
UDF or user defined function is logically, a function created by the user that can be used multiple times (queries, stored procedures, etc.). You can find how to create UDF and the limitations here. This feature is also known as "T-SQL Scalar UDF Inlining".
Let’s create a simple UDF that will calculate the tax amount of one item.
Example:
CREATE FUNCTION dbo.Get_Tax_Amount(
	@Price money
	,@TaxPercent money
) RETURNS DECIMAL (18, 2) AS
BEGIN
	RETURN @Price * 1 / @TaxPercent;
END;
Now, let’s change out database compatibility level to 140 (140 = MS SQL 2017) and run two queries in a batch. In the first query we will use the created function. In the other one we will not use the function, but we will inline the same code from the function.
Example:
SELECT
	[OrderID]
	, SUM([UnitPrice] * [Quantity]) AS [Price]
	, SUM(dbo.Get_Tax_Amount([UnitPrice], [TaxRate])) AS Tax_Amount
FROM
	[Sales].[OrderLines]
GROUP BY [OrderID]
ORDER BY [OrderID];

SELECT
	[OrderID]
	, SUM([UnitPrice] * [Quantity]) AS [Price]
	, SUM([UnitPrice] * 1 / [TaxRate]) AS Tax_Amount
FROM
	[Sales].[OrderLines]
GROUP BY [OrderID]
ORDER BY [OrderID];
The result of two queries is pretty much the same but let’s compare the execution plans for both queries.
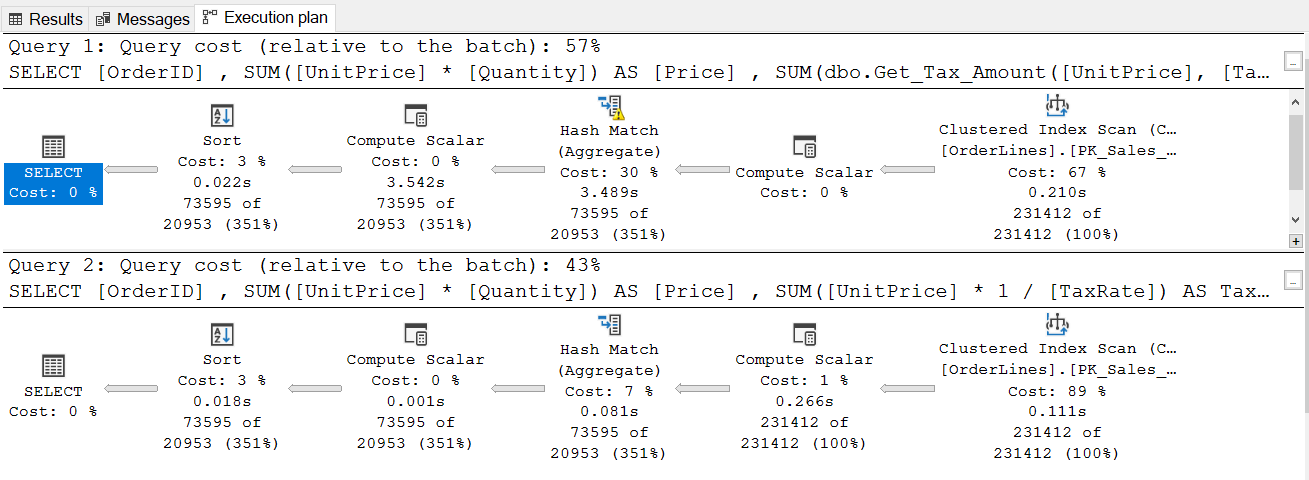
As you can see the first one (with the function – 57%) is more expensive than the second one (43%). Also, if we look at statistics the first query was much slower than the second one:
1)

Table 'Worktable'. Scan count 0, logical reads 0, physical reads 0, page server reads 0, read-ahead reads 0, page server read-ahead reads 0, lob logical reads 0, lob physical reads 0, lob page server reads 0, lob read-ahead reads 0, lob page server read-ahead reads 0.
Table 'Workfile'. Scan count 4, logical reads 464, physical reads 42, page server reads 0, read-ahead reads 422, page server read-ahead reads 0, lob logical reads 0, lob physical reads 0, lob page server reads 0, lob read-ahead reads 0, lob page server read-ahead reads 0.
Table 'OrderLines'. Scan count 1, logical reads 4631, physical reads 0, page server reads 0, read-ahead reads 0, page server read-ahead reads 0, lob logical reads 0, lob physical reads 0, lob page server reads 0, lob read-ahead reads 0, lob page server read-ahead reads 0.

 SQL Server Execution Times:
   CPU time = 3140 ms,  elapsed time = 4228 ms.

2)

Table 'Worktable'. Scan count 0, logical reads 0, physical reads 0, page server reads 0, read-ahead reads 0, page server read-ahead reads 0, lob logical reads 0, lob physical reads 0, lob page server reads 0, lob read-ahead reads 0, lob page server read-ahead reads 0.
Table 'OrderLines'. Scan count 1, logical reads 4631, physical reads 0, page server reads 0, read-ahead reads 0, page server read-ahead reads 0, lob logical reads 0, lob physical reads 0, lob page server reads 0, lob read-ahead reads 0, lob page server read-ahead reads 0.

 SQL Server Execution Times:
   CPU time = 360 ms,  elapsed time = 417 ms.
And the difference is ten times (4288 vs 417 milliseconds)!!!
What was the main reason for that difference? If you look again at the execution plan you will see a small exclamation mark (and a warning) on the “Hash Match (Aggregate)” operator:
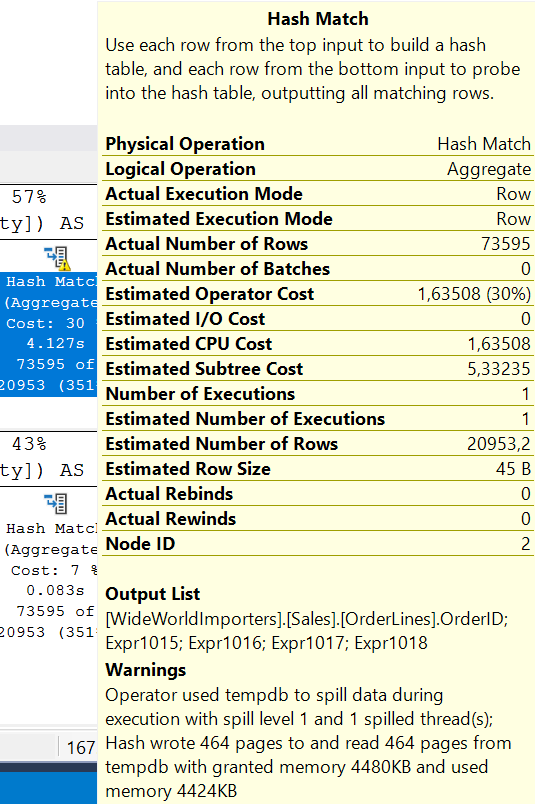
The warning shows us that the first query with the function used the tempdb and that it needed 464 pages (4480KB) to perform the calculation. This is also visible in the statistics output (the “Workfile”) that is not visible in the second query.
Table 'Workfile'. Scan count 4, logical reads 464, physical reads 42, page server reads 0, read-ahead reads 422, page server read-ahead reads 0, lob logical reads 0, lob physical reads 0, lob page server reads 0, lob read-ahead reads 0, lob page server read-ahead reads 0.
On other systems/queries you can get different errors and differences between executions but in almost every example you could see that SQL engine has some problems when using functions rather than the inline code.
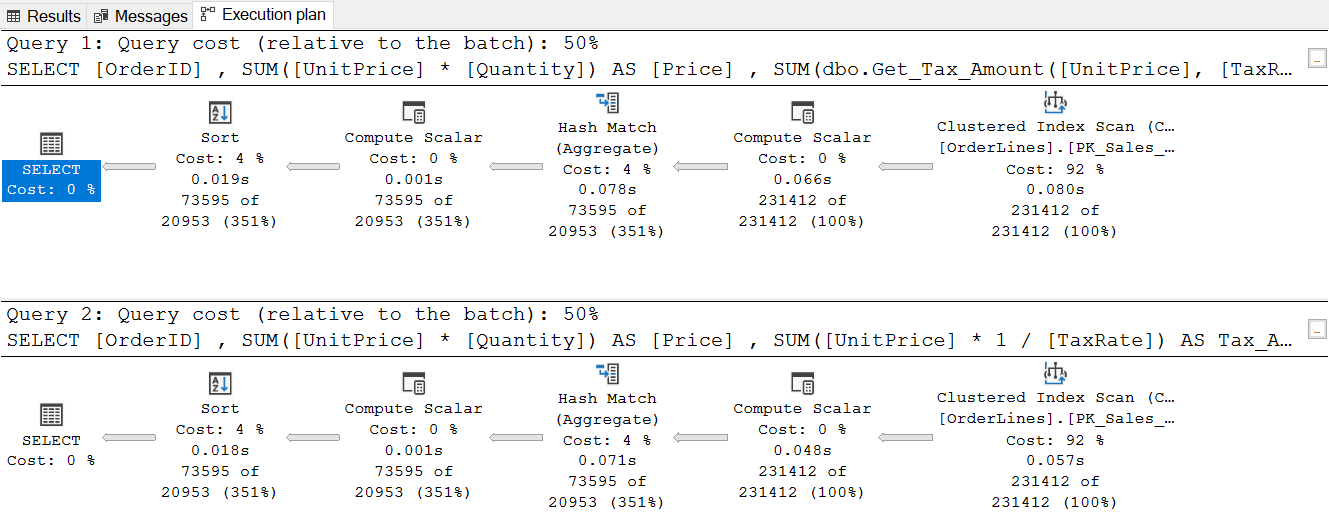
Now, let’s use the last version of SQL engine (SQL 2019) and re-run the same test query to see what the result will be.
1)

Table 'OrderLines'. Scan count 1, logical reads 4631, physical reads 0, page server reads 0, read-ahead reads 0, page server read-ahead reads 0, lob logical reads 0, lob physical reads 0, lob page server reads 0, lob read-ahead reads 0, lob page server read-ahead reads 0.
Table 'Worktable'. Scan count 0, logical reads 0, physical reads 0, page server reads 0, read-ahead reads 0, page server read-ahead reads 0, lob logical reads 0, lob physical reads 0, lob page server reads 0, lob read-ahead reads 0, lob page server read-ahead reads 0.

 SQL Server Execution Times:
   CPU time = 250 ms,  elapsed time = 279 ms.

2)

Table 'OrderLines'. Scan count 1, logical reads 4631, physical reads 0, page server reads 0, read-ahead reads 0, page server read-ahead reads 0, lob logical reads 0, lob physical reads 0, lob page server reads 0, lob read-ahead reads 0, lob page server read-ahead reads 0.
Table 'Worktable'. Scan count 0, logical reads 0, physical reads 0, page server reads 0, read-ahead reads 0, page server read-ahead reads 0, lob logical reads 0, lob physical reads 0, lob page server reads 0, lob read-ahead reads 0, lob page server read-ahead reads 0.

 SQL Server Execution Times:
   CPU time = 234 ms,  elapsed time = 246 ms.
And voila, the execution plans are the same (50% vs 50%). No exclamation marks are visible. No tempdb is used and the queries take almost the same time to complete (279 vs 246 milliseconds). We could say that the database engine is clever enough to “inline” the code when the function is used. This is one of other great enhancement introduced in MS SQL 2019.
*MS SQL Server sample database "WideWorldImporters" can be downloaded at: https://github.com/Microsoft/sql-server-samples/releases/tag/wide-world-importers-v1.0
*You can download the complete SQL Script with all examples from the post here: SQL Script.sql (1.81 kb)